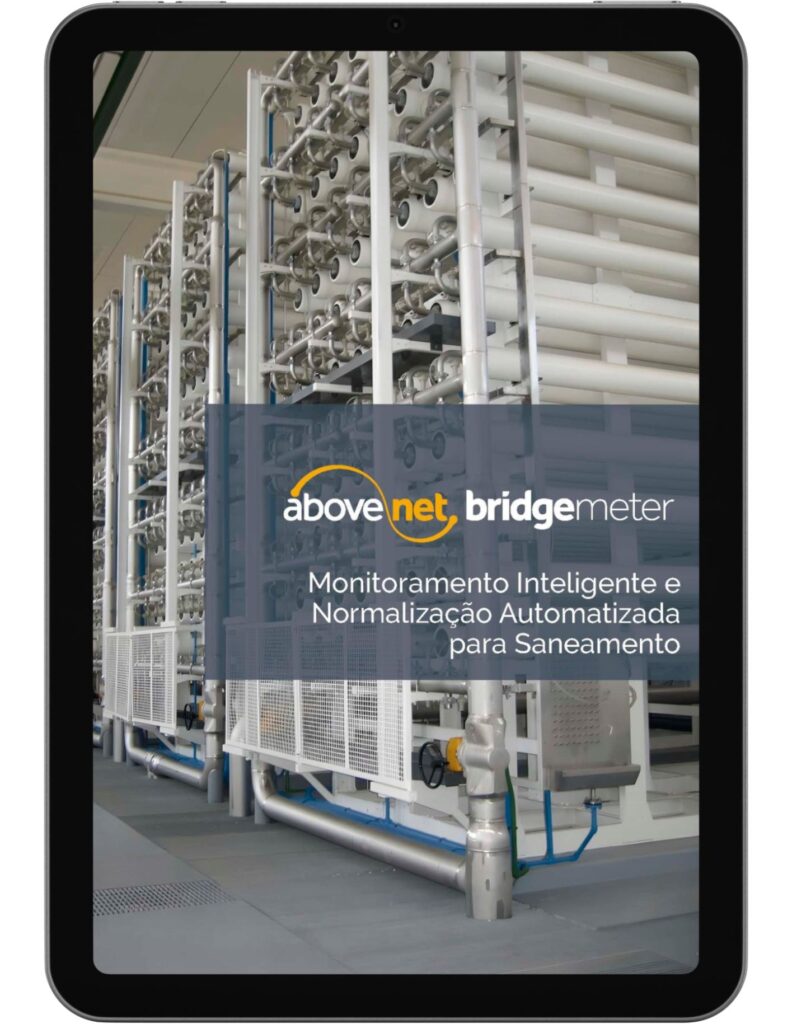
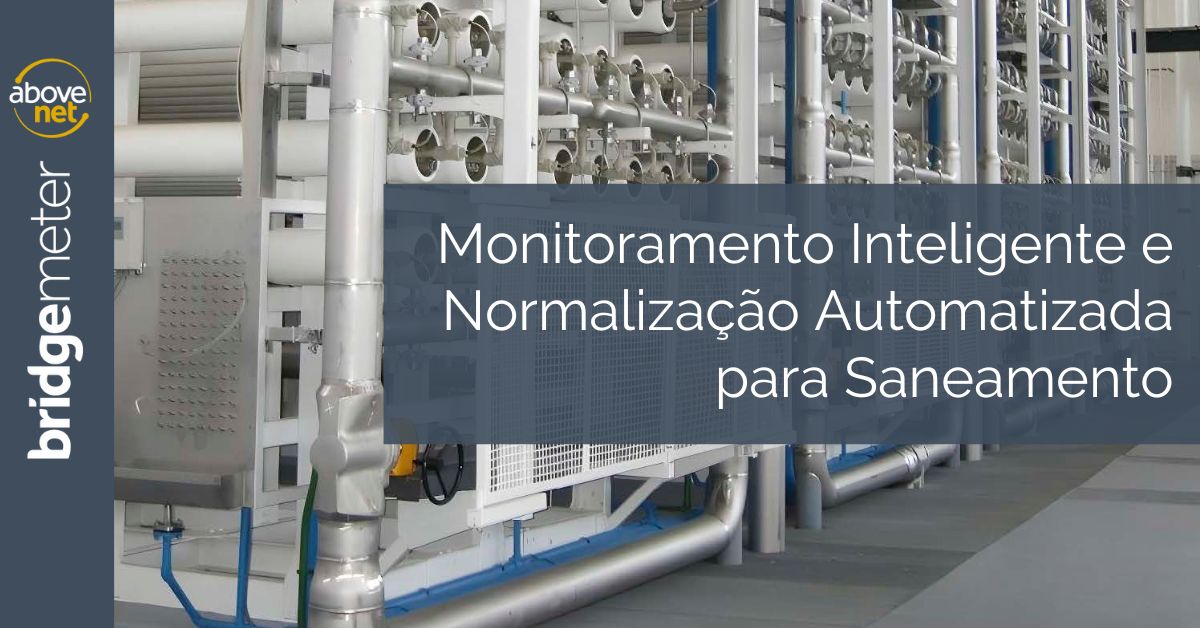
The normalization process in sanitation systems that use membranes, such as in reverse osmosis (RO), ultrafiltration (UF) or nanofiltration (NF) units, is essential to monitor system performance over time and ensure treatment efficiency .
How Normalization Works
Normalizing operating data means adjusting operating data (such as permeate flow and rejection) to standard conditions. This is done so that operators can compare the actual performance of the system at different times, regardless of variations in parameters such as temperature, pressure and dissolved solids concentration.
Impact of Permeate Flows and Rejection
- First Stage : The permeate flow in the first stage generally has a higher flow rate, as it is the initial point where most of the pressure is applied. Normalization here is critical to detect whether there is fouling in the membranes or other forms of degradation.
- Second Stage : In the second stage, the permeate flux tends to be lower due to the decrease in transmembrane pressure and the increase in the concentration of dissolved solids. Normalizing data from this stage helps identify performance issues specific to this point, such as increased fouling or membrane damage.
- Rejection : The rejection rate, or the ability of the membrane to retain contaminants, also needs to be normalized. Normalization helps verify that the membrane continues to reject contaminants efficiently over time, even with variations in feed composition and operating conditions.
Normalization and Efficiency Calculations
Normalizing data allows:
- Operational Efficiency : Identification of drops in performance not related to external variations, allowing preventive interventions.
- Chemical Reduction : Precise monitoring that optimizes cleaning routines, reducing the use of chemicals and environmental impact
Innovation with Bridgemeter
While traditional normalization is performed manually a maximum of three times a day and calculations are made in spreadsheets, Above-Net revolutionized the process by parameterizing Bridgemeter . This solution allows the continuous collection of data from the treatment process, with real-time graphs of:
- Normalized Permeate Flow;
- Driving Pressure and Driving Liquid;
- Rejection Percentage of Each Skid.
Furthermore, the Bridgemeter indicates deviations in operation through proactive notifications, maximizing efficiency and reducing the need for chemical agents, resulting in less environmental impact. This continuous, automated approach provides tighter, more efficient control, ensuring the system operates within optimal parameters with less manual intervention, improving membrane lifespan.

Application
Ready to revolutionize your sanitation operation with automated standardization?
You already understand how Bridgemeter transforms the standardization process in sanitation systems. Now, take that knowledge to the next level with our catalog. Revolutionize your sanitation operation today by saving time, reducing operating costs and improving the efficiency of your treatment plant with Bridgemeter .


